Overview
Purpose
-
This project portfolio documents my role and contributions to the EazyTutors project. I was responsible for the grade statistics features and display of grades.
The Team
-
My team comprises of students from the National University of Singapore and we decided on creating this application after observing the hassle tutors have to deal with when marking attendance.
The Application
-
EazyTutors is a desktop statistics recording application used for managing classes of students. It was created with NUS tutors in mind, but can be extended to tutors or teachers from other organizations as well. The user interacts with it using a CLI, and it has a GUI created with JavaFX. It is written in Java, and has about 10 kLoC.
Features
-
Mark students' attendance
-
Record students' assignment scores
-
Calculate assignment statistics
-
Calculate class performance
-
Add students' photos
-
Record notes about students
Summary of contributions
Preface
This section describes my contribution to the project, including code, documentation and administrative tasks.
-
Major enhancement: Grade Statistics
-
What it does: Calculates the statistics for the grades of an individual assignment or the overall class.
-
Justification: This feature enables tutors to analyse the grades of students to provide relative feedback based on the performance of the class.
-
Highlights: Provides maximum, highest, lowest, 25th/75th percentiles, average, and median grade.
-
-
Minor enhancement: Grade Display
-
What it does: Displays the assignment grades and overall grade for each student.
-
Justification: This enhancement enables tutors to view the performance of each student.
-
Highlights: Calculates the total grade on demand using the specifications of the assignment model.
-
-
Minor enhancement: Attendance Model
-
What it does: Represents an attendance session for a particular date.
-
Justification: This enhancement provides the model for the attendance feature.
-
Highlights: Provides a mapping between each student and multiple attendance sessions with a record of attendance/absence for that session.
-
-
Minor enhancement: Create new person from EditPersonDescriptor
-
What it does: Parses command arguments to create the skeleton for a person with optional fields.
-
Justification: Since creating a new Person requires non-null attributes, this allows the creation of a new Person with the optional fields of EditPersonDescriptor.
-
Highlights: This improves the cohesion because the attributes of the EditPersonDescriptor are populated within the class itself instead of set by another class. The missing attributes are replaced with default values to create a valid new Person.
-
-
Other contributions:
-
Enhancements to existing features:
-
Community:
-
Contributions to the User Guide
Given below are sections I contributed to the User Guide. They showcase my ability to write documentation targeting end-users. |
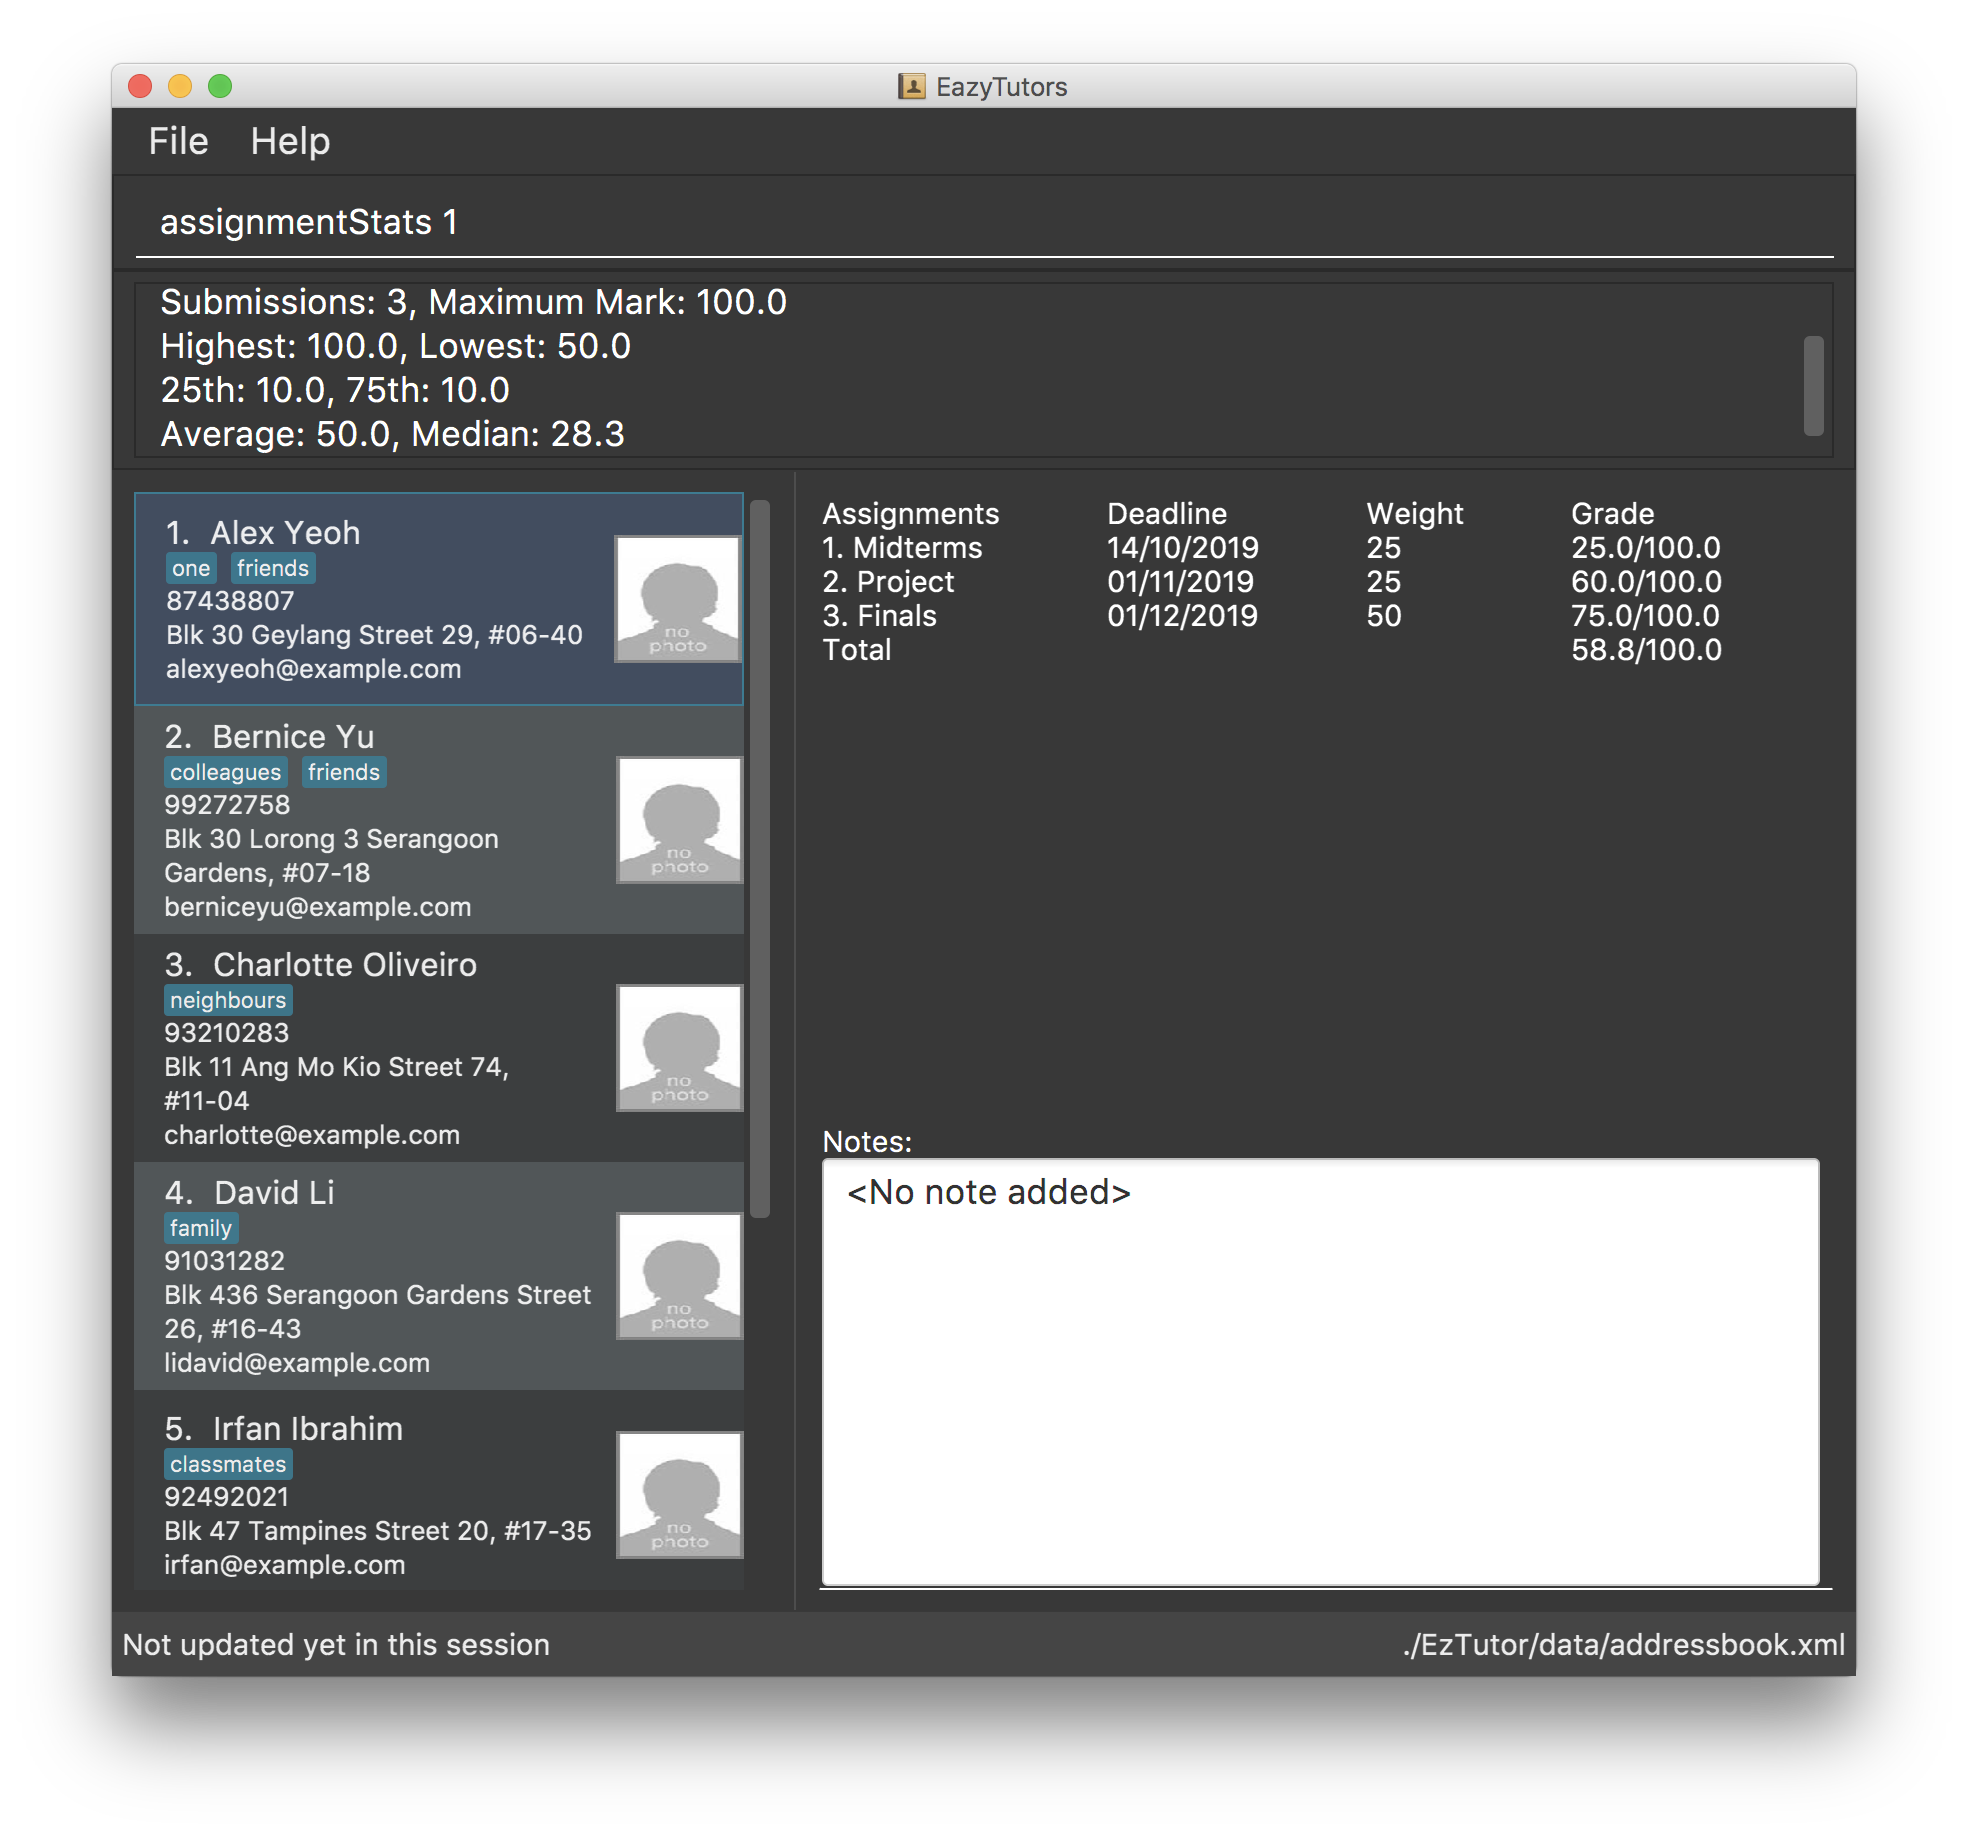
Display the statistics for the marks of an assignment: assignmentStats
Displays the number of submissions and the maximum, highest, lowest, 25th/75th percentiles, average, and median mark for the specified assignment.
Format: assignmentStats ASSIGNMENT_INDEX
Display the statistics for the total grades of the students in the class: classStats
Displays the number of students and the maximum, highest, lowest, 25th/75th percentiles, average, and median total grade.
Format: classStats

Contributions to the Developer Guide
Given below are sections I contributed to the Developer Guide. They showcase my ability to write technical documentation and the technical depth of my contributions to the project. |
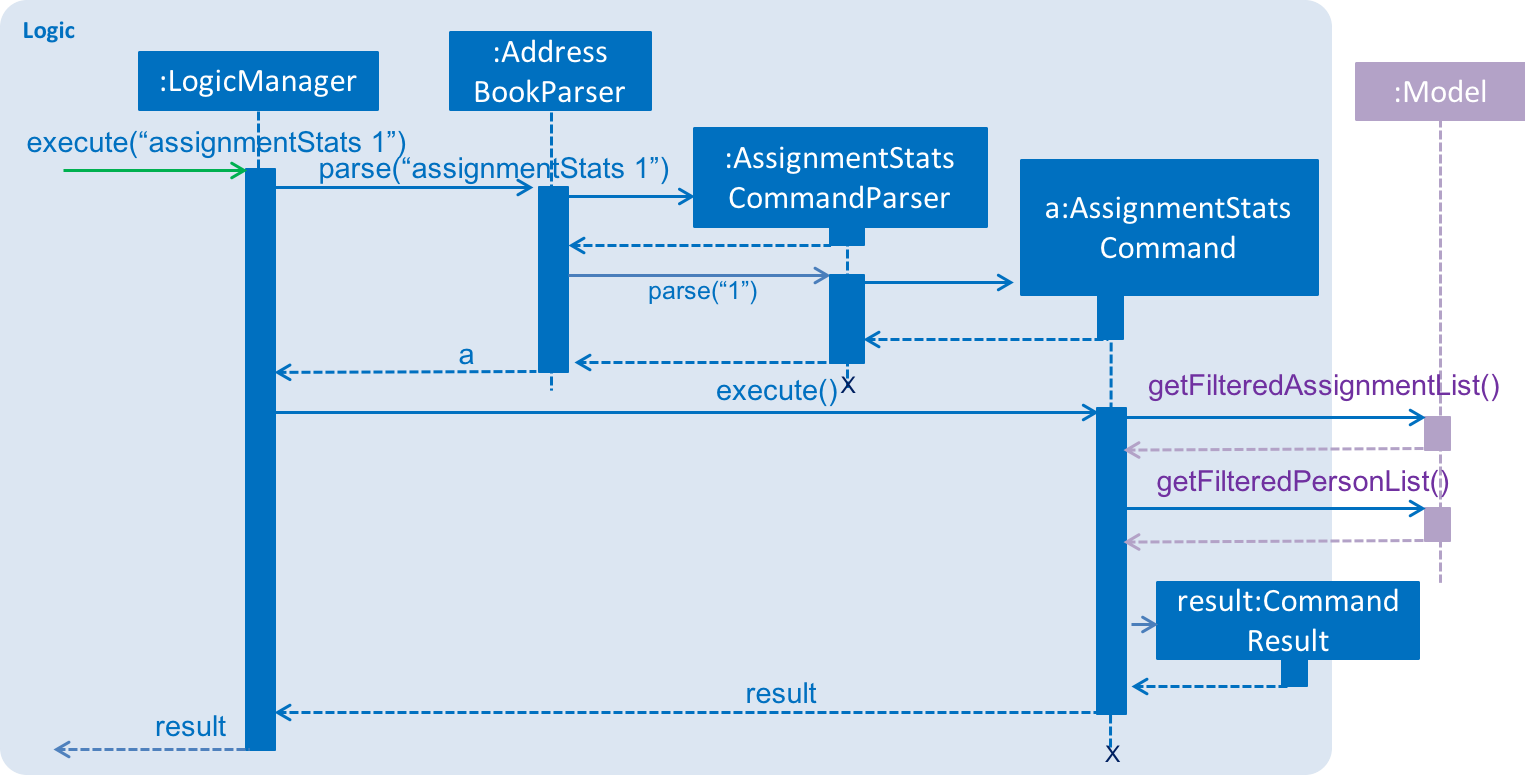
Assignment Statistics feature
Current Implementation
The Mark objects associated with the Assignment are obtained by filtering the Mark HashMap
using the assignment unique id as the key, for each Person in the addressbook.
The maximum, minimum, and average marks are calculated by the DoubleSummaryStatistics object.
The median, 25th, and 75th percentiles are calculated by indexing a sorted array of the Mark values.
Design Considerations
Aspect: Specification of the Assignment Model
-
Alternative 1 (current choice): Use a stream to filter the
Markobjects associated with theAssignment.-
Pros: Implementation follows specification of the Assignment Model.
-
Cons:
Markobjects are associated withPersonobjects, thus requiring several linear operations to obtain allMarkobjects associated with oneAssignment.
-
-
Alternative 2: Create a new mapping between
Markobjects and eachAssignment.-
Pros:
Markobjects can be aggregated over time, eliminating the need to filter each time. -
Cons: Major changes to the specification of the Assignment Model.
-
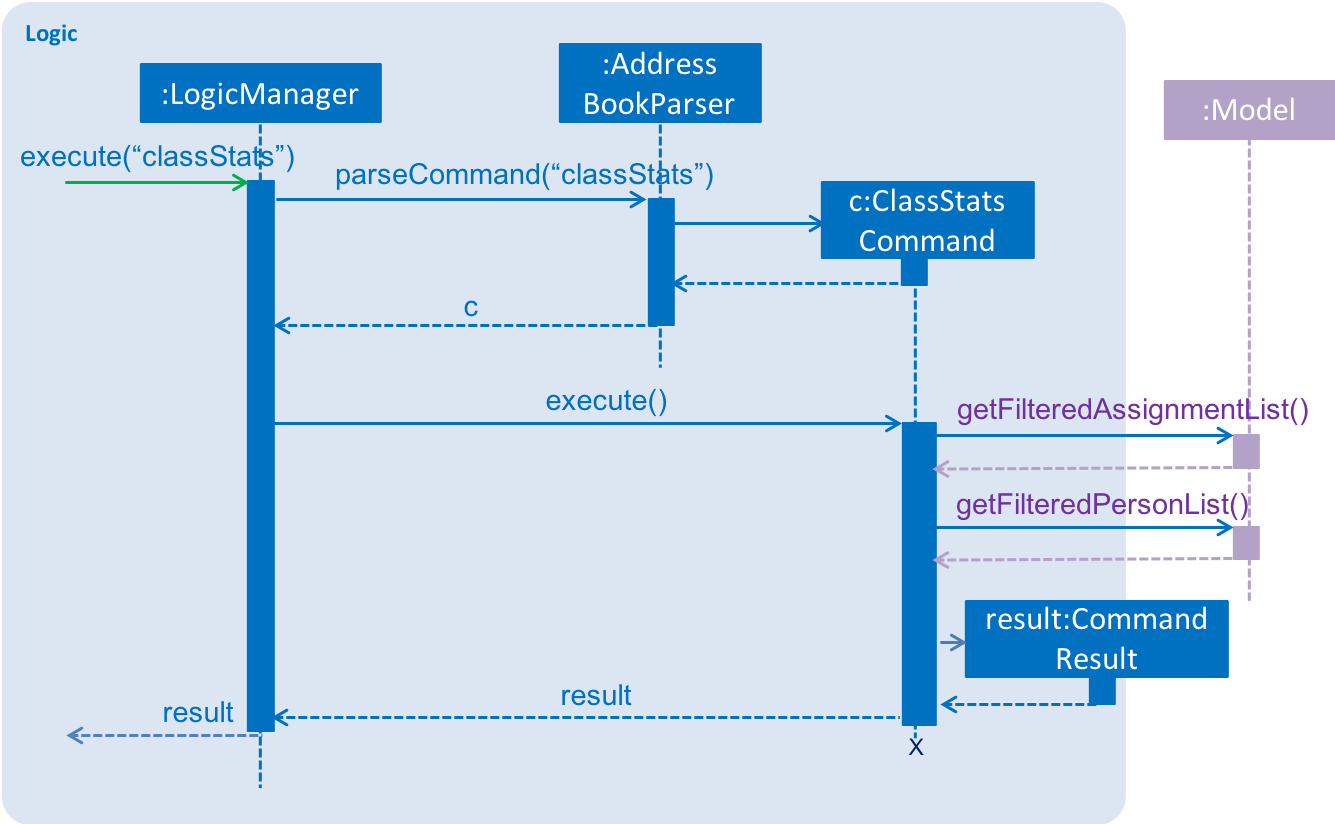
Class Statistics feature
Current Implementation
For each Person in the addressbook, the associated Mark objects are cross-referenced using the
unique id for each Assignment to calculate the grade of each assignment to obtain the
weighted overall grade of each student.
The maximum, minimum, and average marks are calculated by the DoubleSummaryStatistics object.
The median, 25th, and 75th percentiles are calculated by indexing a sorted array of the overall grades.
Design Considerations
Aspect: Specification of the Assignment Model
-
Alternative 1 (current choice): Use a stream to group the
Markobjects by association with eachPersonand calculate the overall grade using the relevantAssignmentobjects for eachMark.-
Pros: Implementation follows specification of the Assignment Model.
-
Cons: Several linear operations must be performed to bridge the association between each
Mark,Assignment, andPerson.
-
-
Alternative 2: Create a class data structure to record the data for the entire class.
-
Pros: Calculations may be performed within the data structure.
-
Cons: Increased operations for each change in data due to high coupling between
Mark,Assignment, andPerson.
-
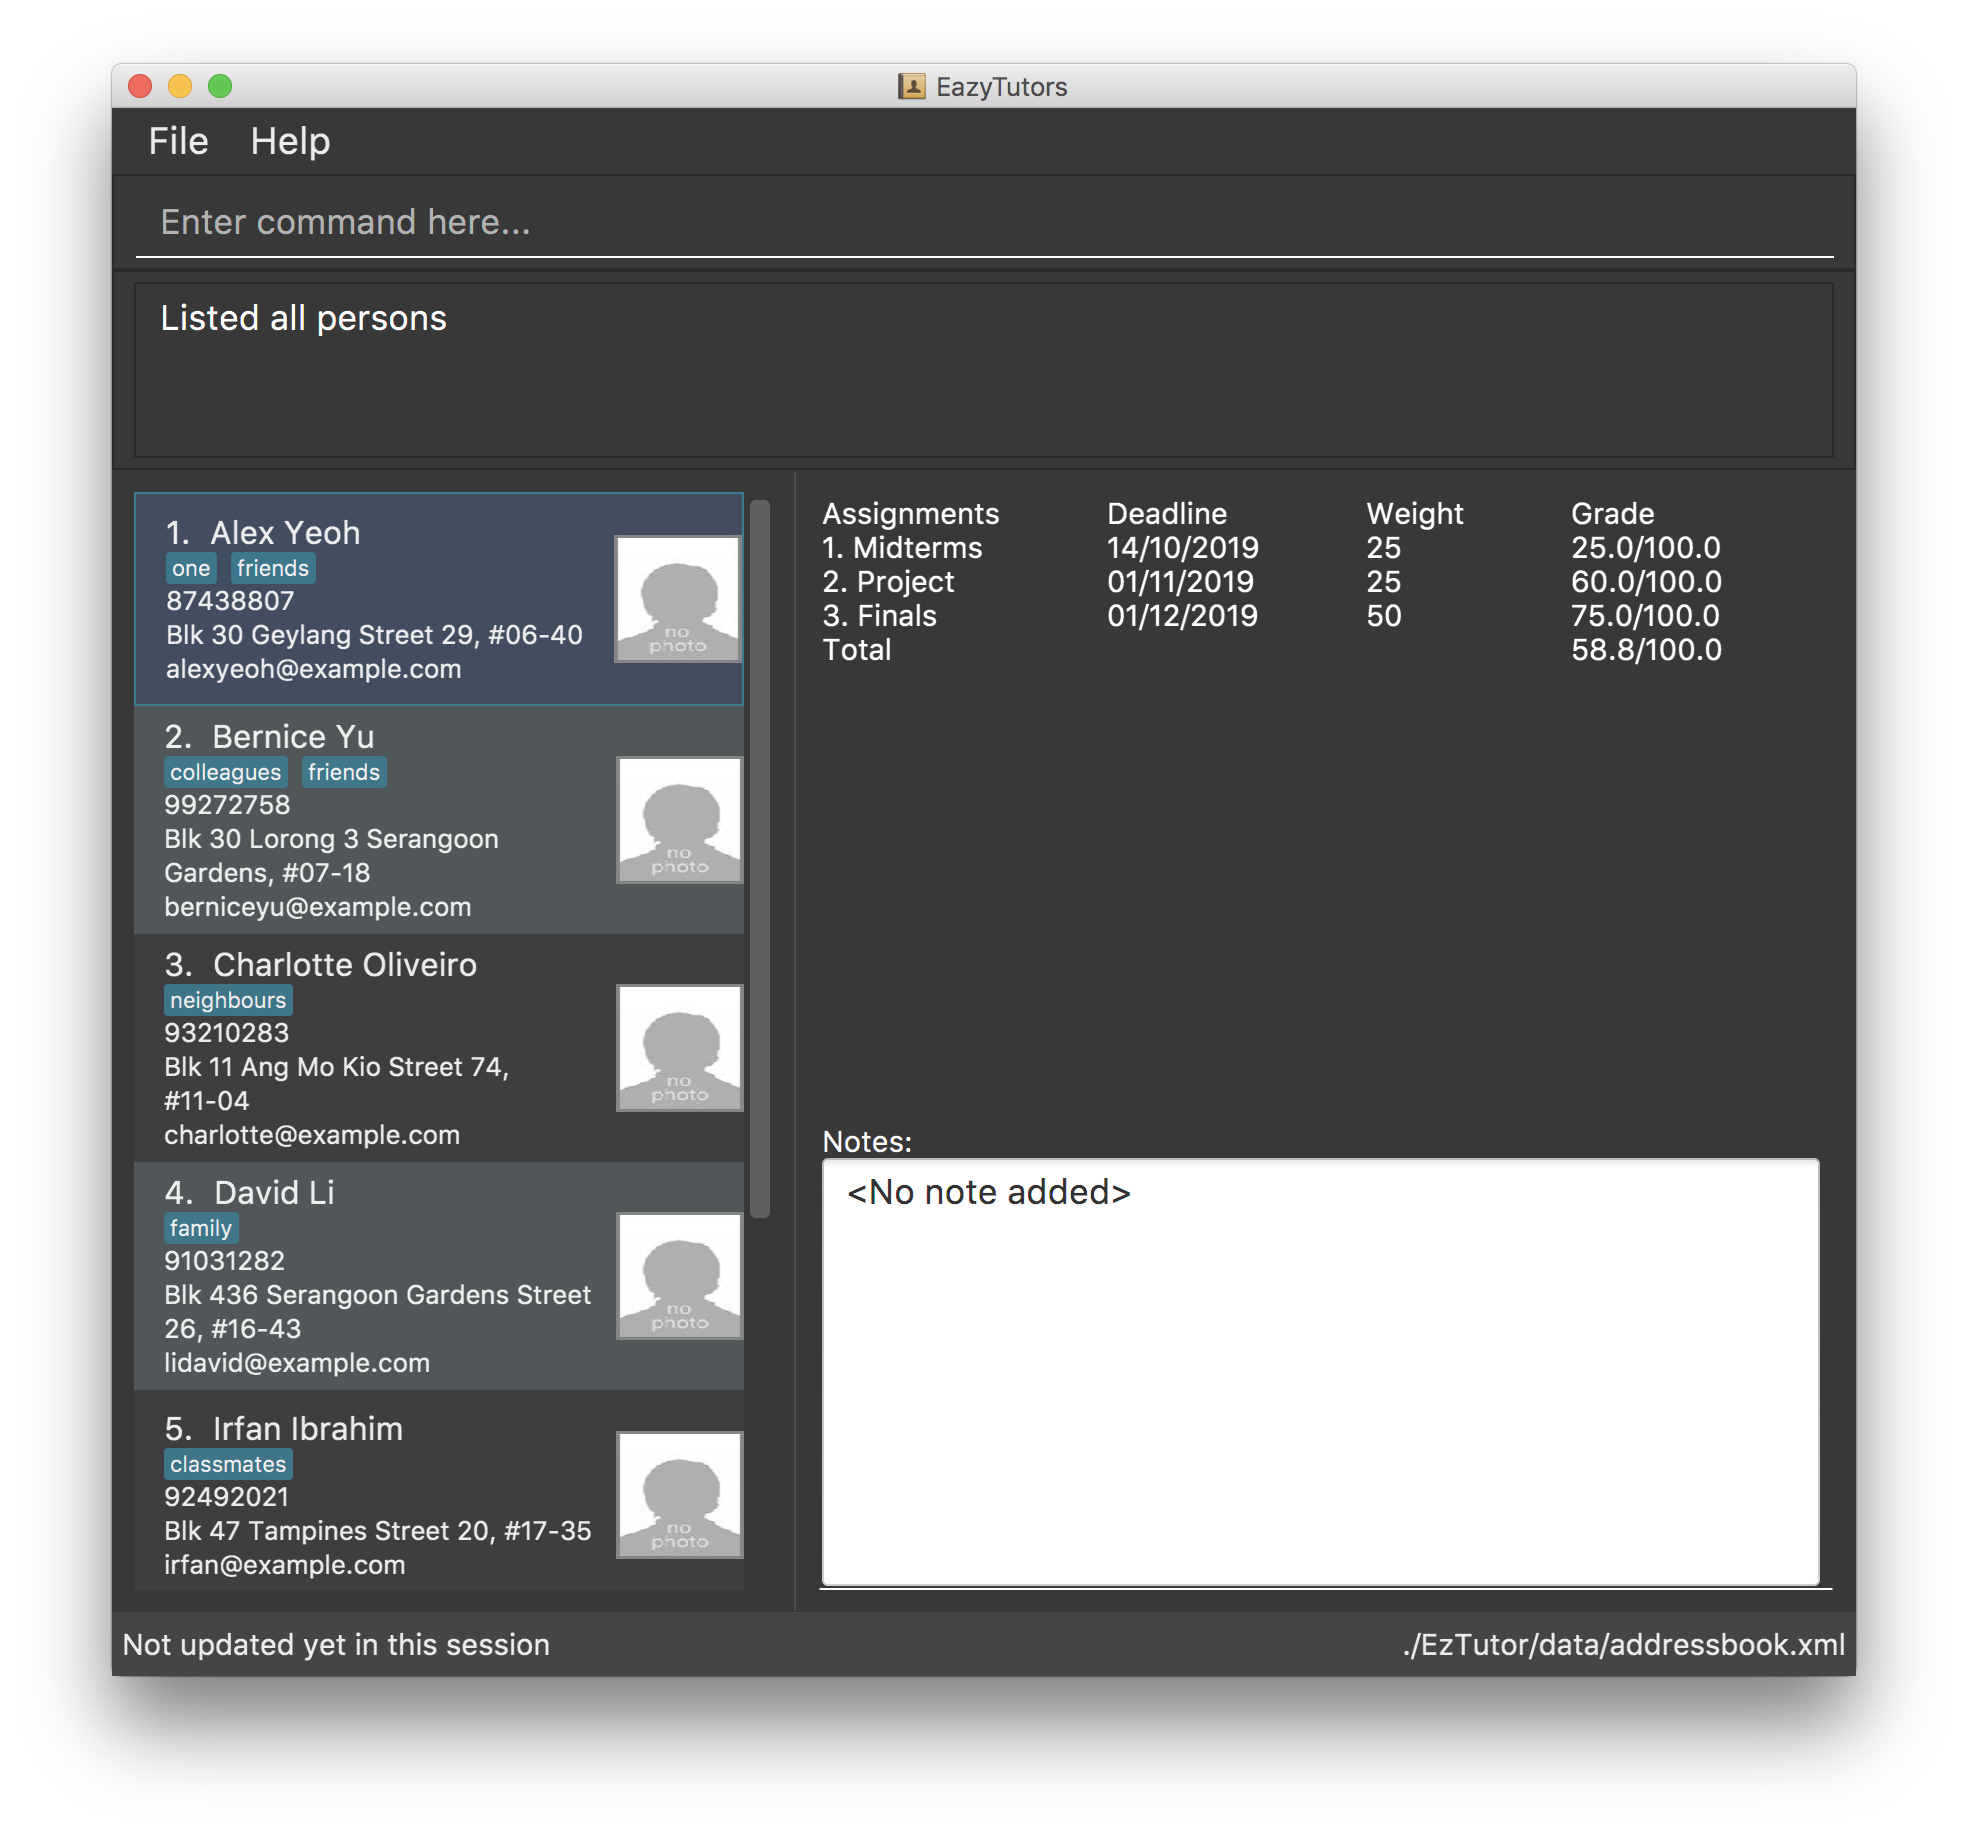
Grade Display feature
Current Implementation
The information for each Assignment object in the addressbook is listed,
including the the index number, name, deadline, weight, mark, and maximum mark.
The mark is obtained from the Mark associated with the selected Person object.
The total grade for the student is calculated as a weighted sum of the marks for all the assignments and listed below.
Design Considerations
Aspect: Evaluation of total grade for the student
-
Alternative 1 (current choice): Calculate the total grade on demand.
-
Pros: Implementation does not require additional models.
-
Cons: The calculation is linear and must bbe performed every time the student is selected.
-
-
Alternative 2: Create a new model to aggregate the total grade.
-
Pros: The total grade is readily available and may be used elsewhere in the application.
-
Cons: Increased operations for each change in data to update the total grade.
-
Attendance data structure
Provides a representation of an attendance session for a particular date. This enables a mapping between each student and multiple attendance sessions with a record of attendance/absence for that session.
Design Considerations
Aspect: Data Structure to support attendance operations
-
Alternative 1 (current choice): Adaptation of Assignment model, using a HashMap for each student to record the attendance/absence with the uniqueId of the Attendance session. AttendanceMark is a subclass of the Mark class from the Assignment model, limited to a value of 1 or 0. The Attendance session date is represented with the Deadline class from the Assignment model.
-
Pros: Limited code duplication, consistent model implementation, prevents inconsistent attendance records across the class.
-
Cons: Calculating attendance requires iterating and mapping.
-
-
Alternative 2: Store a list of attendance marks for each student.
-
Pros: Higher cohesion with attendance data represented together with student.
-
Cons: Attendance session data is distributed across all students which increases complexity of operations affecting all students.
-
Testing Assignment Statistics
-
Statistics of assignment with no marks entered
-
Prerequisites: Students list not empty. Assignment list contains assignments with no marks entered for any student.
-
Test case:
assignmentStats 1
Expected: Statistics data is all 0.
-
-
Statistics of assignment after student with marks deleted
-
Prerequisites: Students list contains 1 student with marks for an assignment.
-
Test case:
delete 1assignmentStats 1
Expected: Statistics data is all 0 because marks are deleted along with the student.
-
-
Statistics of deleted assignment
-
Prerequisites: Assignment list contains an assignment to be deleted.
-
Test case:
deleteAssignment 1assignmentStats 1
Expected: Assignment is no longer accessible, invalid index or index refers to other assignment.
-
-
Statistics of assignment with marks entered
-
Prerequisites: Students list not empty. Assignment list contains an assignment with marks entered for any student.
-
Test case:
assignmentStats 1
Expected: Statistics data is accurate according to the marks.
-
Testing Class Statistics
-
Statistics of class with no students and no assignments
-
Prerequisites: Students list and assignment list is empty.
-
Test case:
classStats
Expected: Statistics data is all 0.
-
-
Statistics of class with students but no assignments
-
Prerequisites: Students list contains students but no assignments.
-
Test case:
classStats
Expected: Statistics shows the number of students, other data is all 0.
-
-
Statistics of class with students and assignments but no marks entered
-
Prerequisites: Students list not empty. Assignment list contains assignments with no marks entered for any student.
-
Test case:
classStats
Expected: Statistics shows the number of students and the maximum grade is the total weight of the assignments, other data is all 0.
-
-
Statistics of class with students and assignments with marks entered
-
Prerequisites: Students list not empty. Assignment list contains assignments with marks entered for students.
-
Test case:
classStats
Expected: Statistics data is accurate according to the total marks of the students.
-